Please notice: This article is more than 3 years oldContent, Source code or links may no longer be correct in the meantime.
October 25, 2020 | 12:22Reading-Time: ca. 3 Min
Whitebox-Monitoring with Prometheus
Winter is coming! Winter time has already arrived, and soon the Corona Lockdown aswell.
Sitting at home in the warmth with a cup of tea, having a complete overview of the IT is a good feeling. The catchword here is “complete”. I don’t rely on traditional blackbox monitoring solutions1 but rather on the whitebox solution called Prometheus2.
Behind Prometheus there is no single company but an initiative of various ones. The who-is-who of the tech industry with RedHat, Amazon, Apple, ARM and many others3. Of course Prometheus comes with a free licence and is completely open-source.
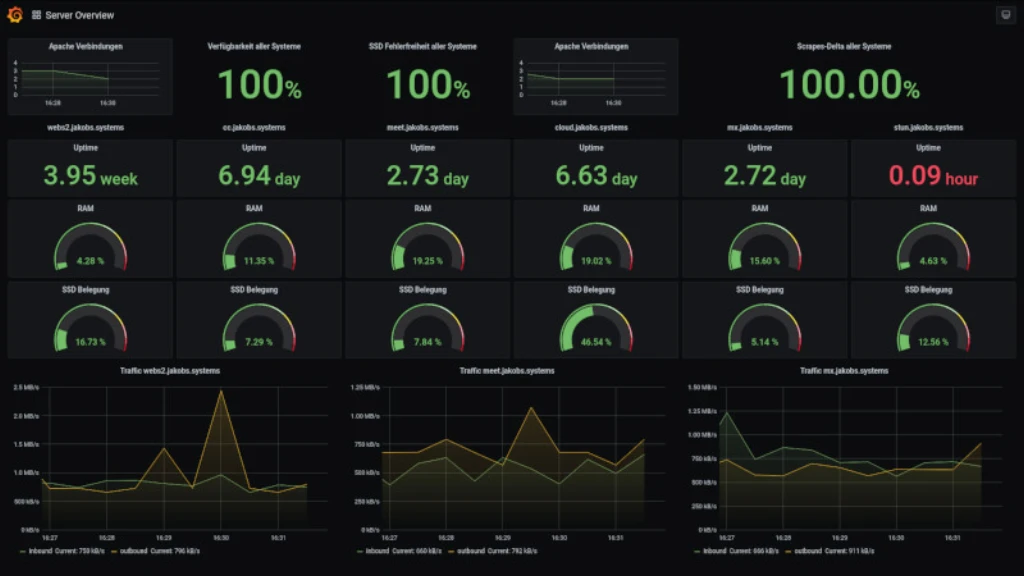
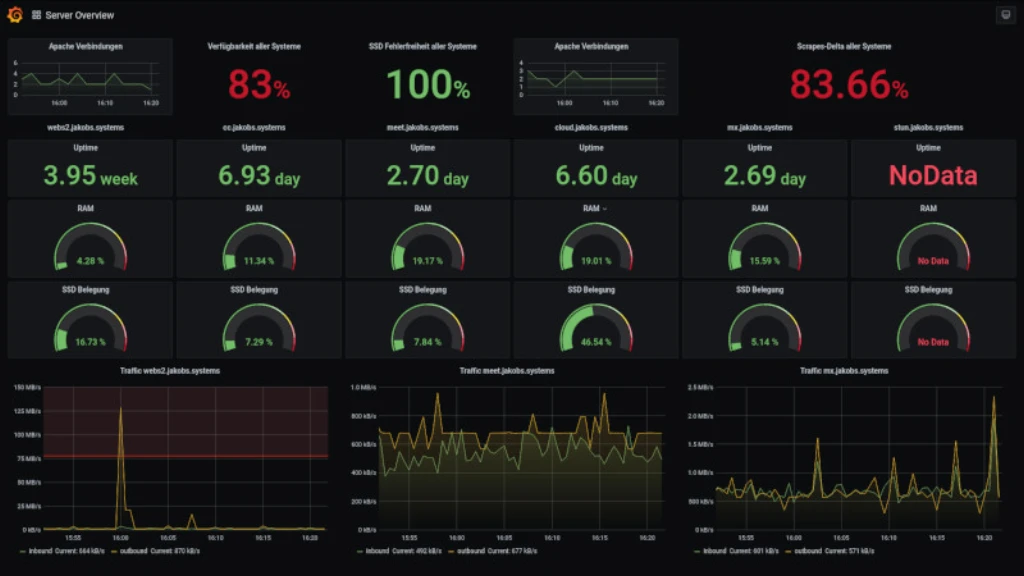
Please do not be deceived by the beautiful Grafana dashboards4 I have made for myself. The screenshots only demonstrate how a server failure is visually displayed. This is something everyone can accomplish with any other monitoring software. What really makes Prometheus so outstanding are the graphs, vectors and time-series behind all this eye-candy.
At best the 3 states for a host or the 4 states for a service in Icinga2 are quite sufficient for alerting. For many, but not for me!
Wouldn’t it be much more smarter, not only to react to an event but also to know how it happened? Is it possible to detect and possibly prevent something proactively? Spoiler: Yes!
Prometheus can be considered as a whitebox monitoring solution that enables you to do exactly that. It works with graphs and timeseries rather than with logs or events. Basically, the values resemble counters that are plotted on a time-line. While Icinga2 actively tries to fetch its values and others run round robin, Prometheus pulls5 hundreds or even thousands of metrics through its HTTP requests. Surprisingly, this is done without a catch of higher load on the hosts or the network. Due to its federated design it even scales significantly better than any other centralised approach6.
For instance: Icinga2 pings a specific service once a minute and receives a response. However if 10 seconds before the service was blocked and 10 seconds after that, again, the world will still be fine for Icinga2 though the phones will already be ringing on the 1st level.
As a software developer I really love the multidimensional queries in Prometheus with the query language PromQL. The tagging of metrics or the integration of webhooks offers a deep insight into microservices and third party applications. The following screenshot is showing such a PromQL query against my email server mx.jakobs.systems.
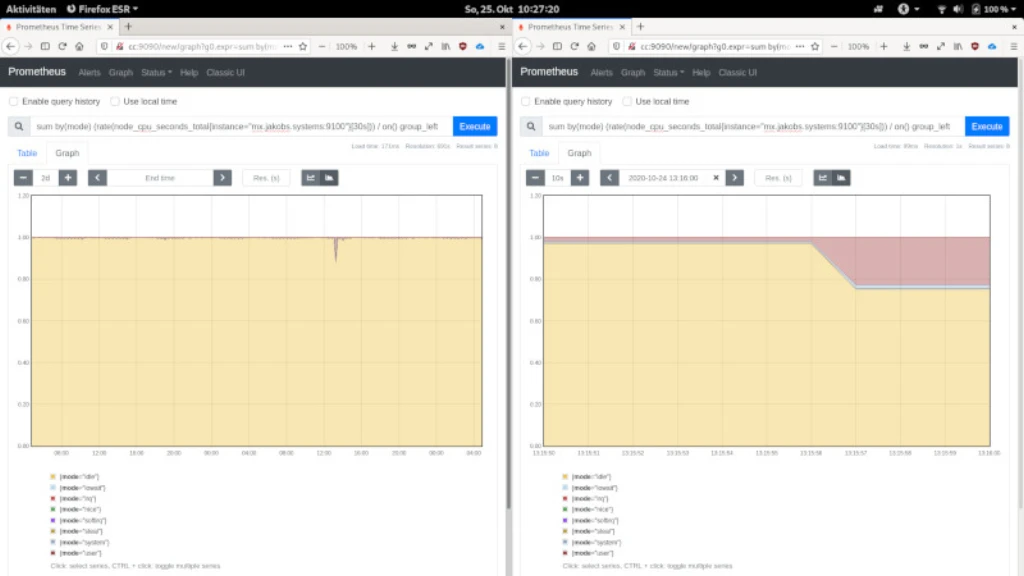
All 8 data points of each 4 Cores are queried. We are talking about querying hundreds of thousands, if not millions of data points, which are answered in just 171 ms on a small Intel 2-Core NUC. No traditional, relational DBMS/PHP stack can achieve this. On the left hand side you see the results over a period of 2 days, on the right hand side you see a zoomed-in version with an accuracy of one second.
All customers with “managed” cloud-, web- or conference servers are automatically included in my monitoring. Customers under support contracts will receive a free installation from January 1st, 2021 on if they provide a suitable system (SSH access on VM or bare-metal) including integration of all bare-metal servers located within the same network segment. Of course there is a corresponding Grafana dashboard on top.
By the way: The scraping of log data should - even if possible7 - not be done. In general this should not be performed on any monitoring application. There are better tools for this job, for instance ElasticSearch.
Due to data protection I deliberately refrain from saving log data permanently. Most of my logs will be deleted after 24h, depends on SLA.